Categories
{{ selectedCategory.name }}
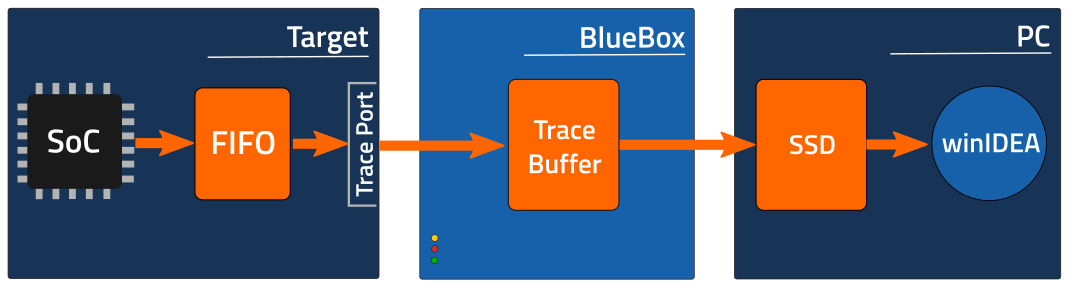
BlueBox trace buffer is full
When the Analyzer stops sampling with the note Trace sampling stopped, reason: Buffer full, a situation has occurred in which the trace RAM buffer of the BlueBox is full and no longer able to accept new data. This happens when trace data is being received faster than the BlueBox is capable of sending out to the PC.
Possible solutions
Use USB communication instead of Ethernet
USB settings
- Use a USB 3.0 port and cable to achieve maximum USB speed.
- Check if your USB port is connected directly to the chipset/CPU and that it isn't connected to PCIe bus (usually slower).
Check UL/crossbar USB speed
Check UL/crossbar speed to get an indication of how fast the data can be read from the BlueBox through the USB connection:
1. Enable logging via Help / Support / Log, option 3.
2. Attach to the target.
3. Search in the log file for Xbar INFO. The value reported here is
representing bandwidth in KBytes/s. This speed must be higher than that of
the trace filling the buffer.
Capable PC disks
Check if the disk on your PC on which the trace data is saved, is fast enough to keep up with the USB transfer rate. Windows has receive/transmit buffers for USB communication, but these buffers are small and if the disk is slow the USB communication speed is consequently reduced.
%ISYSTEM_TEMP% pointing to SSD drive
If your %TEMP% folder is not yet located on an SSD, set the %ISYSTEM_TEMP% environment variable to point to a location on an SSD drive.
More temp space
Make sure you have at least 5 times more temp space as is the TRD file limit.
Reduce the amount of trace data
If USB speed and the disk drive speed can not be further improved, reduce the amount of trace data that is recorded by the Analyzer by:
- Limiting the scope of the recorded variables or
- Excluding code sections that generate excessive amounts of trace messages (such as idle loops)
- Using instrumentation trace (either via data trace, if it can be separated from program trace, or STM trace) is more recommended for large trace recordings than raw program trace.
More resources:
- Trace technologies - winIDEA Help
Sorry this article didn't answer your question, we'd love to hear how we can improve it.
Note: This form won't submit a case. We'll just use it to make this article better.
Similar topics
{{ topic.Title }} {{ topic.Ddate | formatDate }}
{{ topic.Content }}