Categories
{{ selectedCategory.name }}
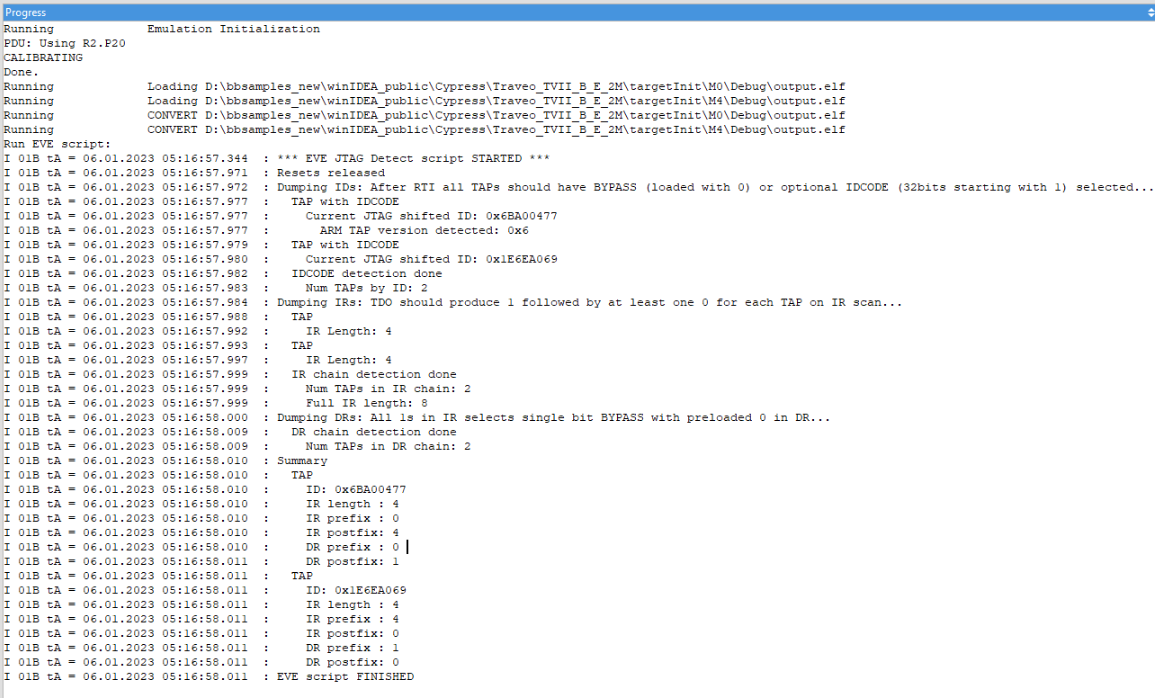
JTAG scan when multiple devices are connected in a chain
JTAG Chain scan functionality enables you to define IR/DR Prefix/Postfix
values which could be entered in Hardware / CPU Options / JTAG. That is
important when several devices are connected in a chain and you want to debug
for example the second one.
Possible solution:
From winIDEA build 9.21.9 and newer:
1. Enable EVE scripting (number 27) via Help / Support / Log.
2. Select any CPU via Debug / Configure Session / SoCs that support JTAG.
3. From the main menu select Debug / Prepare to Attach. winIDEA displays SoC DETACHED in the status bar.
4. Open Hardware / Tools / Execute EVE Script and select JTAGSelect.cpp script which is located in the winIDEA SFR subfolder.
5. Press the Run button.
6. After a few seconds result of the scan is shown in the Progress window.
More resources in winIDEA Help:
- Logging
- EVE Scripting
- JTAG page (ARM Cortex)
- winIDEA Help 9.21.0 - ARM Cortex Setup page (JTAG Chain explained)
Sorry this article didn't answer your question, we'd love to hear how we can improve it.
Note: This form won't submit a case. We'll just use it to make this article better.
Similar topics
{{ topic.Title }} {{ topic.Ddate | formatDate }}
{{ topic.Content }}