Categories
{{ selectedCategory.name }}
Failed to initialize debug session / Emulation start failed
The error means that the debugger failed to connect to the target CPU. This can be for different reasons.
When troubleshooting the initial debug connection to the target CPU, it is recommended to use the CPU Reset instead of Download.
Possible problems and solutions
BlueBox is not properly connected to the target debug connector
Check:
- Connection via Debug Adapter or Active Probe.
- Pinout of the target debug connector matches with the one from the Debug Adapter or Active Probe.
Infineon TriCore: DAP/DAPE configuration issues
The necessary voltage is not connected to the target LPD debug connector or JTAG/Nexus debug connector
Refer to Setting debug interface voltage levels (Vref).
BlueBox hardware can be damaged (Connector on the BlueBox, Debug Adapter, Active Probe)
Try to confirm this with another working BlueBox system. In case you confirm that the BlueBox hardware is damaged, contact technical support.
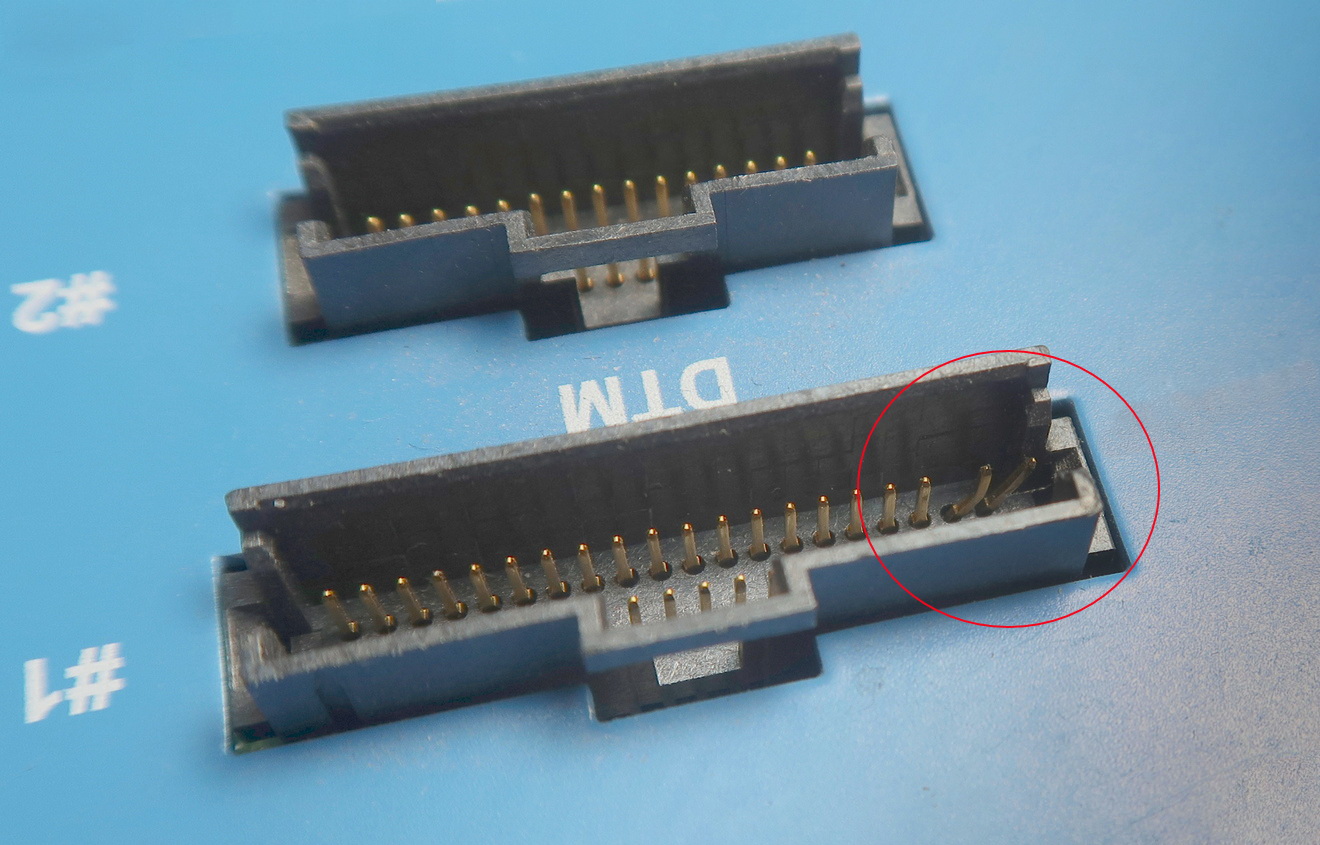
If pins in connectors (in most cases pin 40 on ST1 connector) are bent, possible errors are: Error 250: FP5 Serial Communication error (Renesas RH850), DAP initialization failed (Infineon TriCore), CPU initialization failed (NXP/ST Power Architecture).
The Target CPU can be damaged or permanently locked (e.g. by programming the wrong UCB data)
Try to test the BlueBox on another target or try to replace the CPU with a new one.
Active Watchdog prevents establishing a debug session
Disable all reset sources during debugging. See further explanation.
Incorrect JTAG Scan speed configuration
Open Hardware / CPU Options / JTAG and configure the Scan speed.
ARM Cortex-M: Failed to initialize debug session
Infineon TriCore: Failed to initialize debug session / DAP Initialization
failed
Sorry this article didn't answer your question, we'd love to hear how we can improve it.
Note: This form won't submit a case. We'll just use it to make this article better.
Similar topics
{{ topic.Title }} {{ topic.Ddate | formatDate }}
{{ topic.Content }}